

The U.S.–Israeli strike on Iran in late February 2026, followed by Iranian retaliation, has triggered unprecedented turmoil in the arteries of global energy and maritime trade.
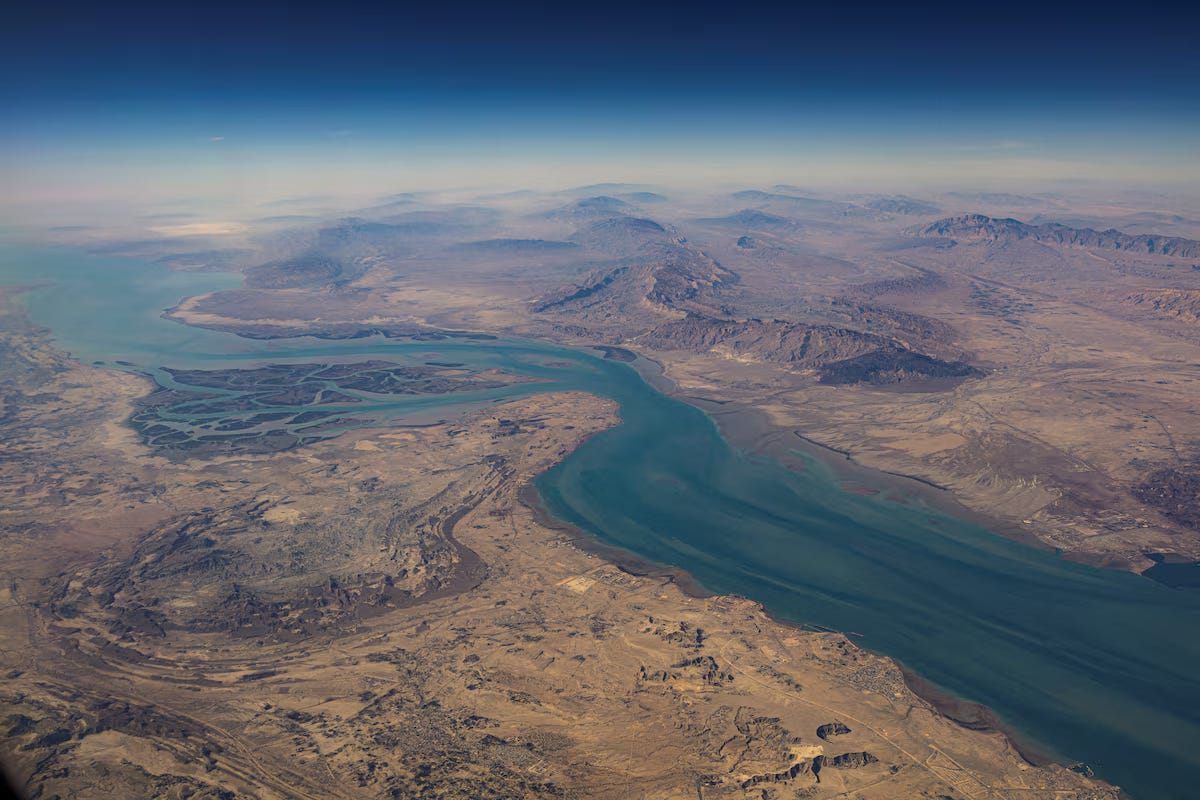
The immediate impact has centered on the Strait of Hormuz, through which roughly one-fifth of the world’s oil and a similar share of liquefied natural gas (LNG) transit. Sources within Iran’s Islamic Revolutionary Guard Corps said that “the strait is closed” and that “any vessel attempting to pass will be set ablaze,” effectively halting maritime traffic despite the absence of a formal Iranian declaration of closure.
This report examines the scale of the maritime disruption as of March 3, 2026, its broader implications, and the alternative routes available for oil and gas exports along with the costs these detours impose on trade across the Gulf and the wider world.
Strait of Hormuz: How Severe Is the Disruption?
1. Vessel Traffic:
Data from MarineTraffic in early March showed at least 150 tankers anchored in open waters outside Hormuz, with dozens more on the opposite side near the coasts of the United Arab Emirates and Oman.
By March 2, transit through the strait had nearly ground to a halt. According to Kpler, only three tankers carrying a combined 2.8 million barrels passed through down from more than 20 million barrels per day prior to the crisis. In effect, crude flows dropped by over 90 percent.
2. Direct Damage:
At least four tankers were struck and two sailors killed in the opening days of the conflict. Operations at Jebel Ali Port were temporarily suspended after missile debris fell in the vicinity.
3. Insurance and War Risk Premiums:
Marine insurers announced the cancellation of war-risk coverage in the Gulf effective March 5, forcing shipowners to secure new policies at sharply higher rates.
War-risk premiums surged to around 1 percent of a vessel’s value, up from roughly 0.2 percent—equivalent to hundreds of thousands of dollars per voyage.
4. Freight Costs and Energy Prices:
Charter rates for Very Large Crude Carriers (VLCCs) on the Middle East–China route doubled to approximately $12 million. Brent crude rose more than 10 percent, while LNG prices jumped by roughly 50 percent. Spot LNG freight rates climbed nearly 40 percent, according to market data.
Route One – The Short but Risk-Laden Corridor
The Gulf route via the Bab el-Mandeb Strait and the Suez Canal remains the shortest passage to Europe. Yet it comes with significant constraints. The Suez Canal does not allow fully laden supertankers to pass.
Large vessels must either offload part of their cargo or rely on the SUMED pipeline, which has a capacity of about 2.3 million barrels per day limited when compared to Hormuz flows exceeding 20 million barrels per day.
Meanwhile, attacks in the Red Sea and Bab el-Mandeb continue to threaten shipping. Canal traffic fell by 50 percent in early 2024, prompting companies to reroute via the Cape of Good Hope.
With the current crisis, major container lines Maersk, Hapag-Lloyd, CMA CGM, and MSC—have suspended Red Sea transits. Passage through this corridor is therefore a high-stakes gamble, one unlikely to stabilize without firm guarantees against further Houthi attacks.
In terms of cost, the voyage via this route typically takes around 19 days. Heightened military tensions may require naval escorts and additional insurance, extending transit times and raising expenses further.
Container lines have imposed additional insurance surcharges ranging between $1,500 and $4,000 per container, on top of elevated war-risk premiums.
Route Two – The Longer but Safer Detour
When the Red Sea becomes impassable, vessels are forced to sail around Africa via the Cape of Good Hope.
This route imposes no size restrictions but significantly extends voyage times. A Gulf–Europe journey takes about 35 days instead of 19 via the Suez Canal an additional 16 days at sea.
Large LNG carriers burn fuel worth between $30,000 and $35,000 per day. An extra 16 days therefore adds roughly half a million dollars in operating costs, excluding crew wages and maintenance. The longer circuit also reduces fleet availability, as each shipping cycle takes more time to complete.
During the 2024 Red Sea crisis, the Shanghai Containerized Freight Index doubled and freight rates surged by more than 100 percent. In 2026, markets could witness comparable spikes if disruptions in both Hormuz and the Red Sea persist simultaneously.
Who Pays the Price?
Global trade and Asian economies in particular are bearing the brunt of this dual disruption through sharply higher shipping fees and commodity costs. Countries such as China, India, Japan, and South Korea depend on Hormuz for more than 80 percent of their oil imports.
Container shipping lines have imposed immediate war-risk surcharges to offset mounting hazards. Hapag-Lloyd announced additional charges of $1,500 per standard twenty-foot equivalent unit (TEU) and $3,500 for refrigerated containers linked to Gulf routes, while CMA CGM applied fees of up to $4,000 for special equipment.
On the insurance front, a rise in war-risk premiums to 0.5 percent means that a container vessel valued at $150 million would pay $750,000 per transit up from $375,000 before the crisis.
In energy markets, shipping disruptions and the temporary suspension of gas production at Qatar’s Ras Laffan facility pushed Brent crude up more than 10 percent, approaching the $82-per-barrel threshold, while European gas prices surged by as much as 54 percent.
Qatar halted LNG production at Ras Laffan following attacks on facilities. Reports indicate that 150 LNG carriers remain stranded, some losing between 50 and 100 tons per day due to cargo boil-off. These cumulative costs are ultimately passed directly to end consumers, compounding inflationary pressures.
The suspension of transits by major container lines through Hormuz and the Red Sea has effectively sidelined roughly 10 percent of the global container fleet, threatening global supply chains and disrupting segments of air freight as well.